Chapter 5 Data Collection and Flights
5.1 Hardware - DJI Matrice 300 RTK (M300)
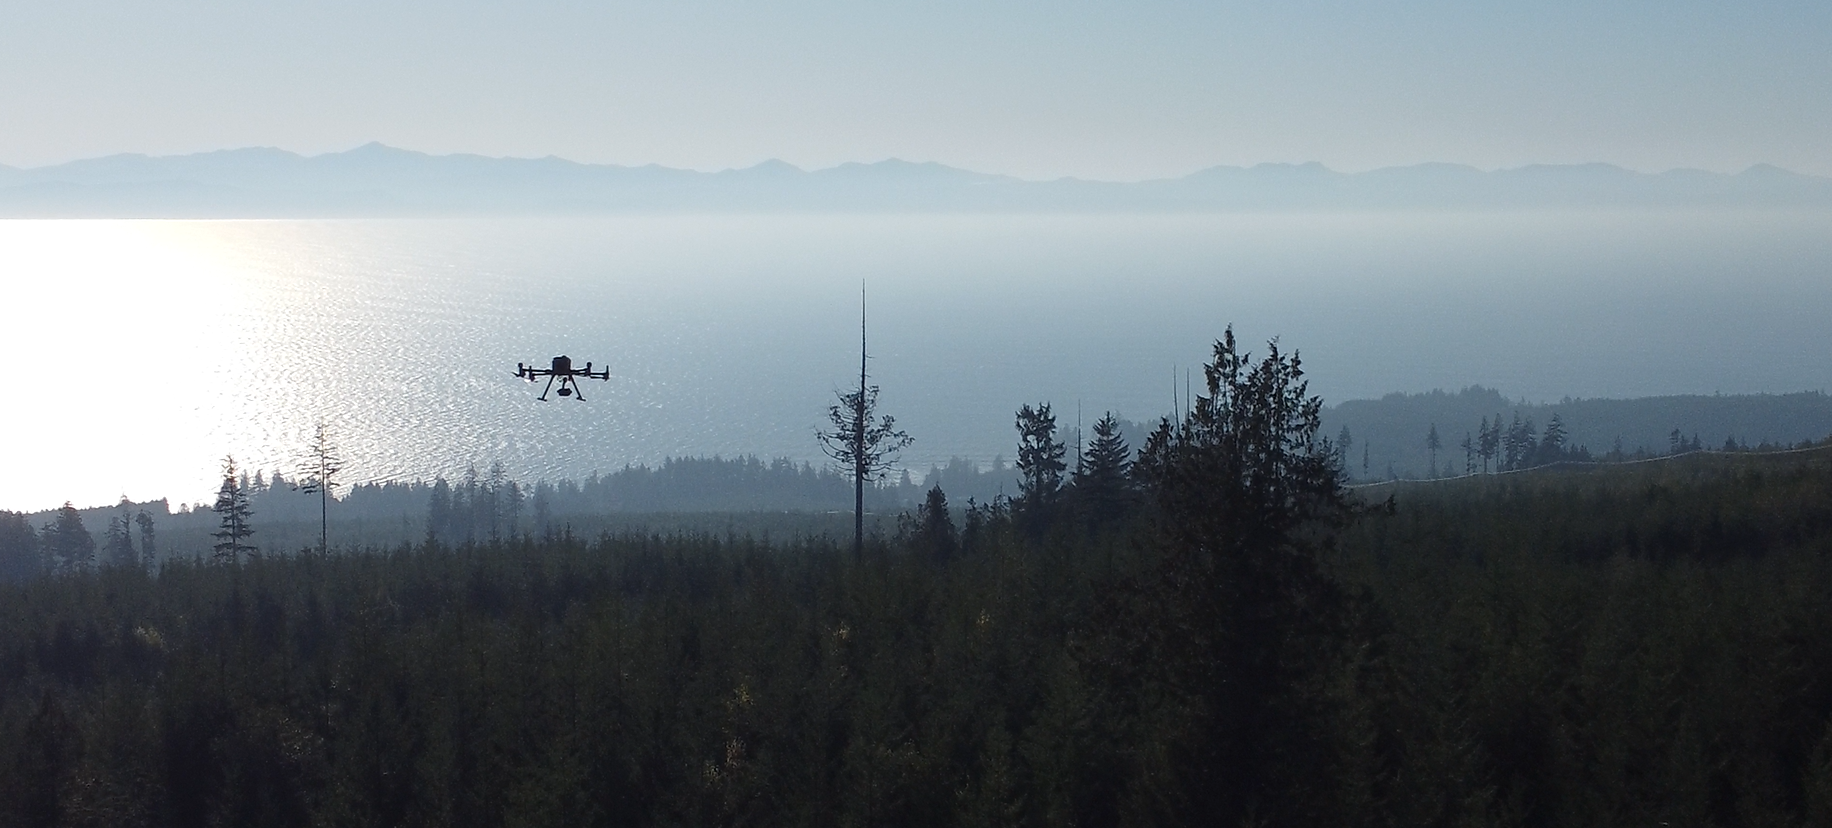
Figure 5.1: DJI Matrice 300 RTK in flight over one of our Vancouver Island field sites, taken by Alex Liu with a Mavic3.
A complete SOP for mapping flights with the M300 was developed in-house and can be found in the SOPs folder on GitHub. Transport Canada (TC) regulations require logging all flights and to have the logs on-hand when flying. We have developed a simple spreadsheet that logs the details required by TC and other useful details for each flight. When undertaking a project with repeated data collection campaigns, we would recommend developing a similar approach to organizing these data. A copy of the one we use is available within the Example Documents folder on GitHub.
While the DJI M300 drone can fly in heavy rain, wind and under any light conditions, flying under such conditions can damage your equipment or create artifacts in the resulting data and generally reduce data quality and usability. Each sensor has specific requirements for producing the best-quality data, outlined in greater detail below. It is highly recommended to keep the flight app and all hardware up-to-date and to familiarize oneself with the “Release Notes” before each trip as the DJI platform evolves quickly. App and hardware updates require Wi-Fi, so updating in a location with service is crucial, ideally you can do this before visiting the field.
5.2 Battery Management
Managing battery life is an ongoing concern when flying drones. The DJI M300 documentation claims 55-minute flight time without a payload on one set of batteries. We have found flight time with a payload on newer batteries to be 30-35 minutes and 25-30 on older batteries. To keep enough batteries charged for a field day we start the day with four sets of charged batteries in the battery station and bring a small generator into the field to charge batteries as they are used.
The M300 RTK system is compatible with the TB60 and TB65 batteries. However, it is important to note they cannot be mixed when used on the drone’s two battery sockets. The TB60 and TB65 batteries have different voltage ratings and internal configurations, and mixing them will lead to imbalanced power distribution, and potentially causing power fluctuations or damaging the drone’s power system.
For each set of batteries, it is also important to differentiate between them. If batteries are used interchangeably, their charge and discharge rates will quickly begin to vary and so will their capacity. Therefore, it is required to mark them in pairs and only use them as such.
It is possible to manually set the discharge rate for each individual battery when it is slotted in the drone. The setting can be found under the battery logo of the triple dot menu in camera view. This can be helpful when you may have a few days before the next set of flights. By default, DJI batteries will automatically discharge to 95% after twelve hours, but after the user set time in days it will begin to discharge to 50-60%, the default setting is 2 days before safe discharge occurs.
5.3 Workflow: Site Reconnaissance
Ahead of the first data collection flights we follow the reconnaissance workflow outlined in Figure 5.2. This is to assess for hazards, confirm site perimeter, layout GCPs and collect their coordinates (where possible), and to locate trees to enable georeferencing existing trial data to the imagery. We followed this workflow in March 2024 at the Big Tree creek trial where were able to find suitable locations to install GCPs and were able to collect precise GPS points for the GCPs. We also measured azimuth and distance from the GCPs to the nearest trees to enable us to tie the row column grid to the imagery (georeferencing) later in the processing. Please refer to the SOP_Emlid_RS3 for detailed instructions on using the Emlid GNSS receivers. The Emlid RS3 documentation is excellent and covers a wide range of applications.
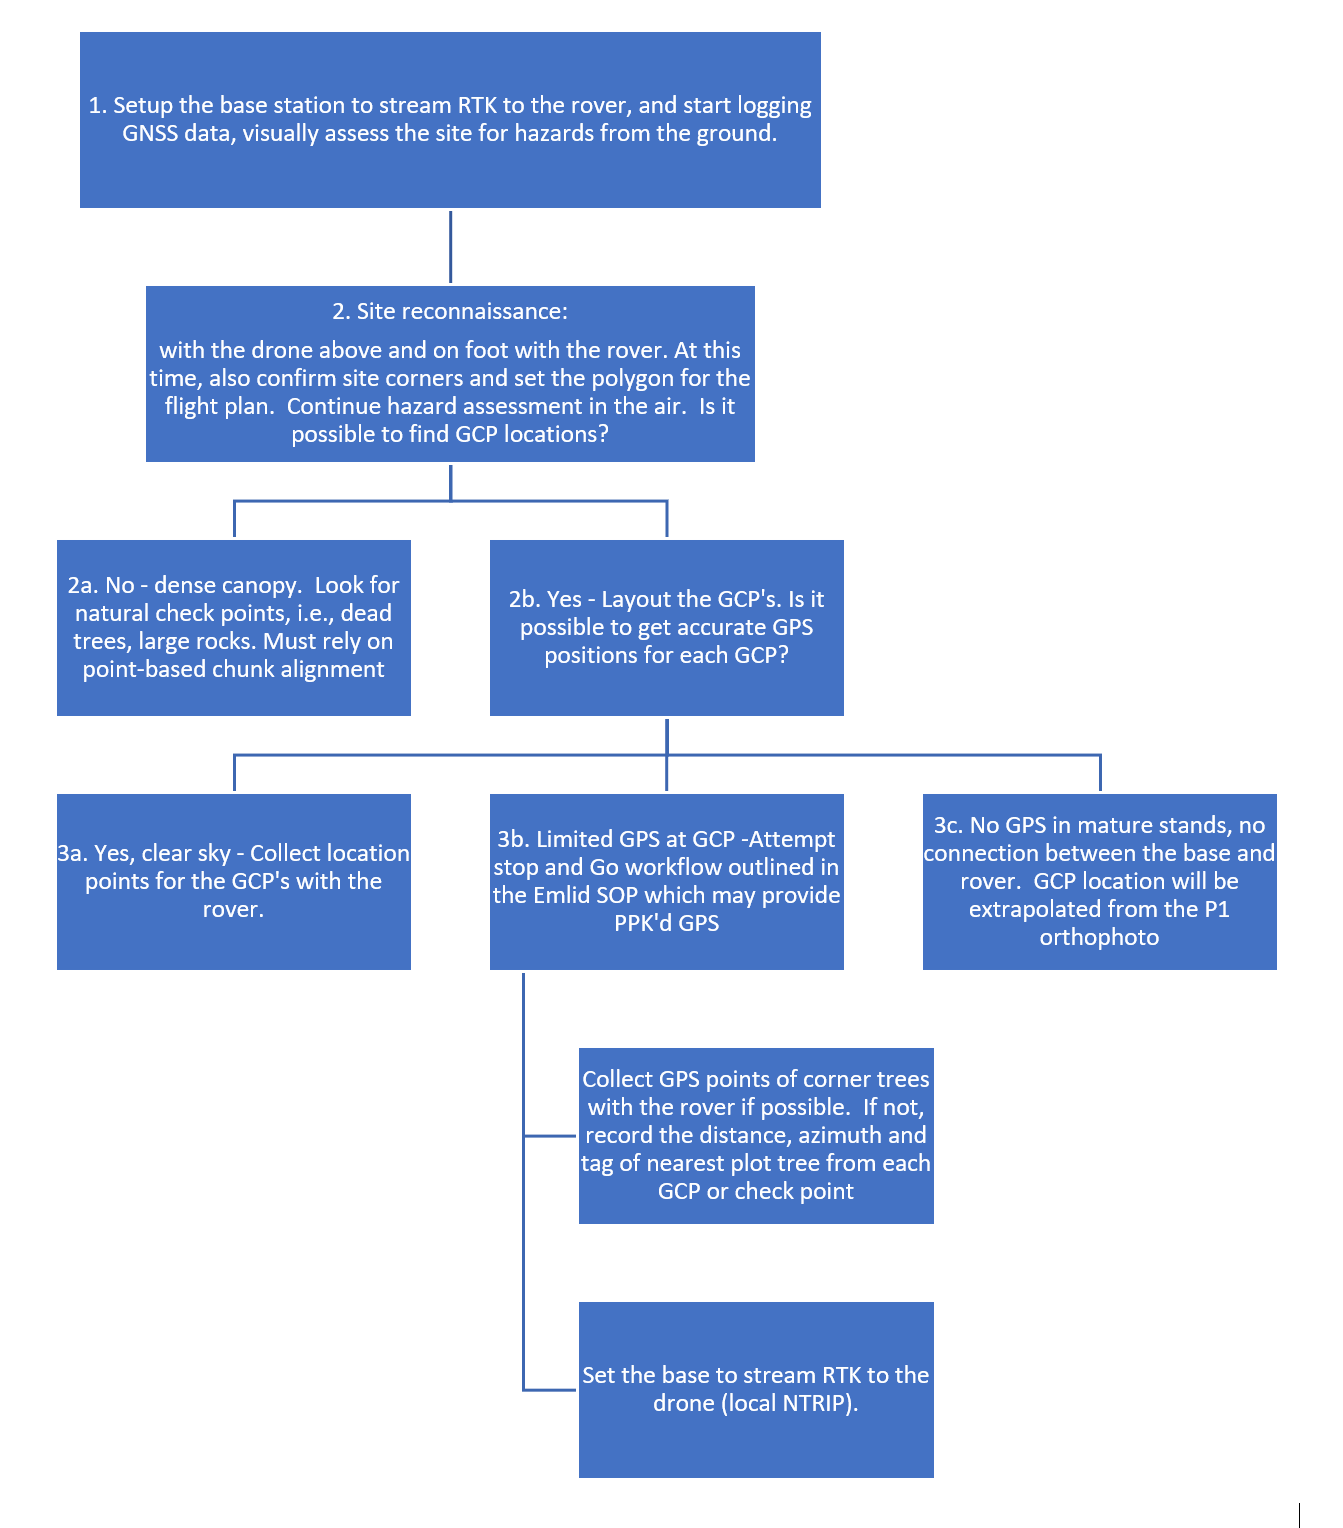
Figure 5.2: Reconnaissance workflow.
5.4 Data Collection: Flight Planning
5.4.1 Flight planning theory
In drone photogrammetry, Ground Sampling Distance (GSD) is a critical measure that represents the pixel size on the ground, directly influencing the resolution of the images captured. A smaller GSD indicates higher detail, meaning that more information is available in each image. The GSD is primarily determined by the drone’s altitude and the camera’s resolution—lower altitudes result in a smaller GSD, offering finer detail in the images.
The primary variables in the flight planning software are altitude, speed, and overlap (both front and side). Higher altitudes increase GSD, covering more area but reducing image resolution. Speed must be adjusted carefully; slower speeds ensure better image overlap and minimize motion blur, which is especially important in windy conditions. Overlap is critical for ensuring that each image captures enough common ground with adjacent images to allow for accurate 3D reconstruction and data processing. Higher overlap generally improves the quality of the final data but also increases the number of images required and the overall length of the flight. The required overlap is complicated by the complexity of the surface. We have found that attaining high quality output imagery on bare ground requires considerably lower overlap. This is due to two reasons, first, displacement of free moving objects on bare ground, such as sticks and rocks commonly found on recently logged trials, requires very strong winds and is overall a less complex surface than a closed canopy with thin coastal treetops moving in a breeze. The second reason is the elevation of the canopy itself. Unless you are using a DSM the overlap calculation is based on the elevation from the ground. When flying over mature sites with closed canopy the effective altitude is the flight altitude minus the canopy height. This will decrease the effective, or canopy, overlap which is an important consideration when collecting data over what is already a complex structure.
Figure 5.3 outlines the difference in ground overlap and canopy overlap. We have developed a calculator in which you enter the flight altitude, overlaps, and canopy height and it will output the canopy overlap. You can then adjust the inputs until you get the required overlap. It is available in the Example Documents folder on GitHub. Figure 5.3 below is an example calculation detailed in the next paragraph.
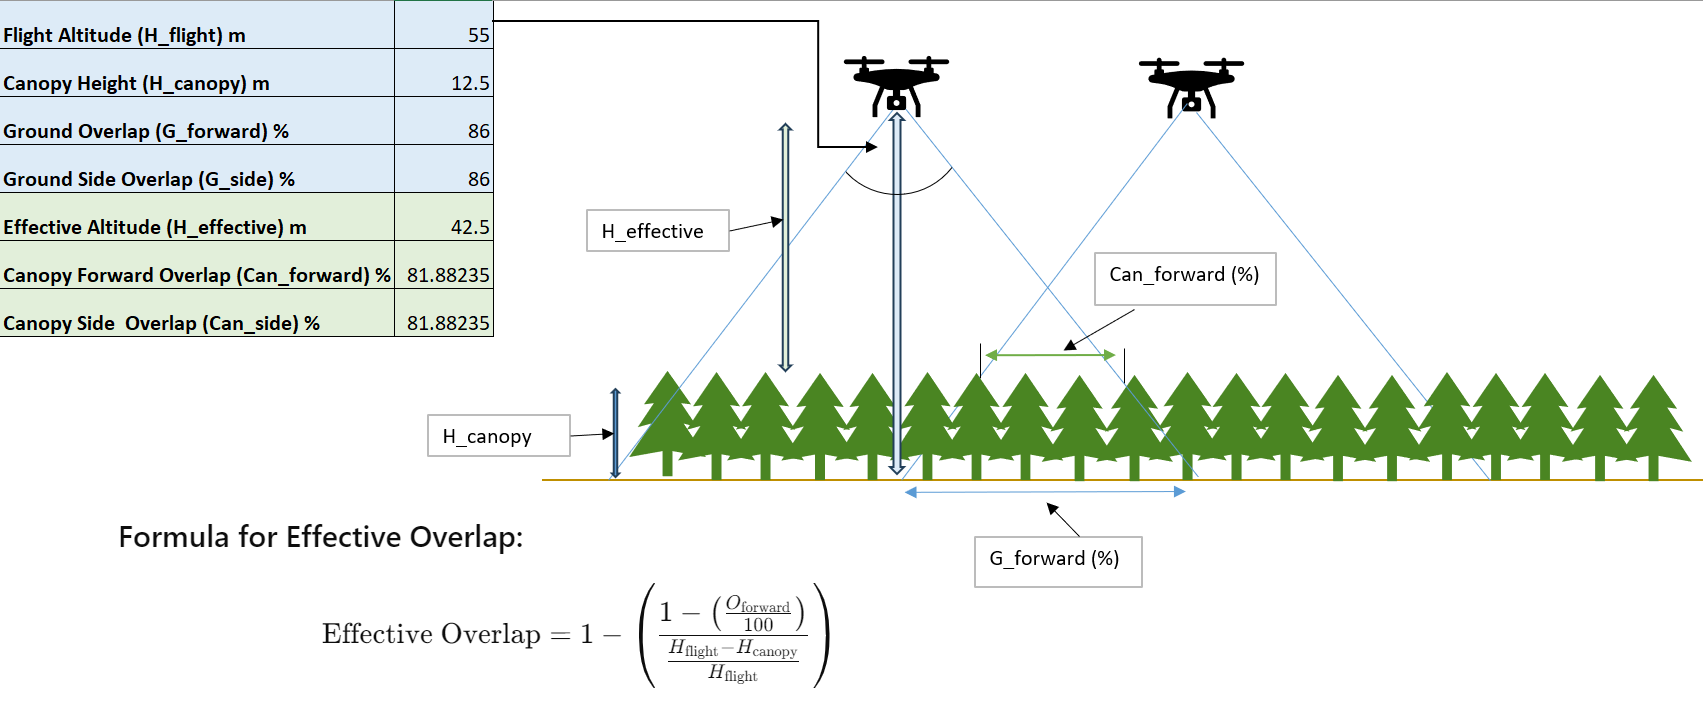
Figure 5.3: Effective overlap calculation.
5.4.2 Flight planning with DJI Pilot
There are various flight planning software options. We chose the DJI Pilot app, which comes installed on the remote control (RC), for its ease of use. The Big Tree creek Douglas fir site has approximately 2900 gridded tree planting positions at 2 m spacing. Because there was no accurate polygon for the site prior to the project, we marked positions for GCPs and made waypoints for the corners of the site with the DJI Pilot app during the reconnaissance flight. We then built the flight plan polygon from the corner points and added an extra margin for the first flights. Once the site corners were confirmed, for subsequent flights, we remade the polygon in a Geographic Information System (GIS) and clipped to 15 meters outside the edge trees. This polygon is the flight shape and was 2 Ha for the Big Tree site. While doing this reconnaissance flight, the pilot scouted the site for hazards and noted that, within 20 meters of the site, there were mature wildlife trees left standing after the last harvest. The median tree height for plot trees was 12.5m however, the wildlife trees were approximately 45 m tall. To allow for a 10m safety margin above the wildlife trees the minimum elevation was set to 55 m. Additionally, the site is on a 25 percent slope, which required terrain following. Flight planning is sensor-specific, after entering the sensor, the app presents a list of options. See Figure 5.4 for a visual of the site polygon and flight parameters for a P1 flight. The recommended flight parameters for each sensor are quoted in the next section.
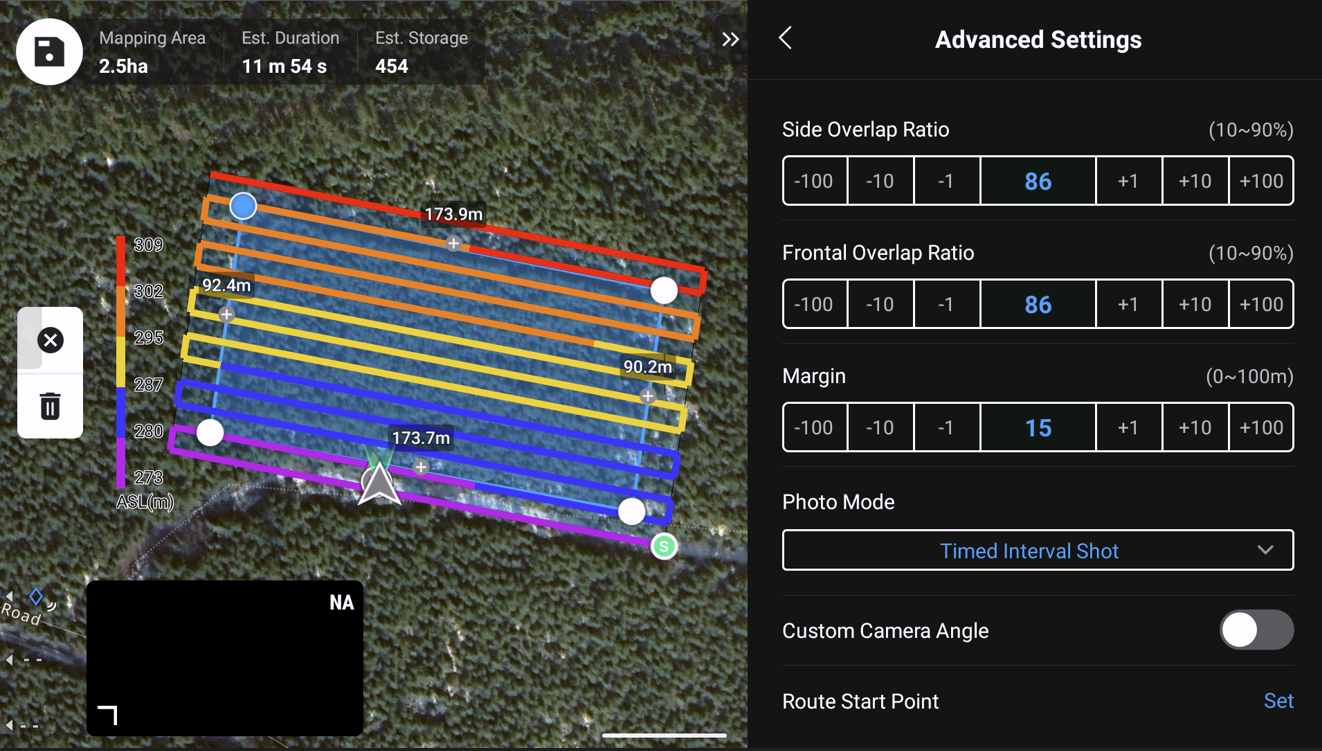
Figure 5.4: Flight planning a P1 flight on the remote controller. Colored lines represent terrain following elevation.
5.5 Data Collection: Sensors, Parameters, and Ideal Conditions
The parameters we have listed for each sensor are based on our experience collecting data on gridded 1.5 - 2 Ha open and closed canopy coastal Douglas fir and Western redcedar sites. The parameters are conservative and should allow for less than ideal flight conditions. More detailed paramaterization tests are ongoing and will be included in further edits.
5.5.1 MicaSense: 10-Band Spectral Sensor for Vegetative Indices
The MicaSense RedEdge-MX Dual (MS) and its replacement, the Micasense RedEdge-P Dual (MS_P), (where P represents panchromatic), are 10-Band multispectral sensors that detect reflectance in ten specific wavebands of reflected light that provide useful information on vegetation health. The MS_P includes an 11th camera that is senstive to a wide range of wavelengths across the visible and NIR spectra, allowing it to capture a much larger amount of light (photons) per capture, and thus producing a higher spatial resolution product that allows for pansharpening.
The MicaSense (MS) cameras are powered by the M300, but the gimbal mount only provides power; the camera itself is not integrated and does not communicate with the drone or remote controller. The camera is started via a laptop or phone though a Wi-Fi port connection housed on the MS and runs until the camera is linked again and stopped or the drone is powered down.
The multispectral cameras are passive sensors and as such are sensitive to changing light conditions. To detect these changes Micasense cameras use a Downwelling Light Sensor (DLS), which is mounted to the top of the M300, to measure ambient light conditions during flight and sun to sensor angles. These measurements are written into the metadata of each photo. We are using the DLS2 which measures the ambient light and sun angle using 10 small circular sensors spread across the top of the DLS. Hence, it is imperative that these sensors are clean to avoid erroneous measurements.
Multispectral sensors also require calibration photos to be taken at the start and end of each flight. This involves taking pictures of a specialized MicaSense calibration panel with known reflectance values. These pictures need to be taken in an open area for the DLS to correctly mimic the current flight conditions, ideally the location is large enough to avoid scattering from nearby vegetation or other objects. Ensure there are no shadows being cast onto the panel or over the DLS as these calibration pictures are taken, either from nearby objects, vegetation, or the person taking the photos.
As seen in Figure 5.5 the MicaSense Dual cameras are two sets of cameras, each captures 5 unique wavebands. The cameras write images as .tif with an _(x) for each of (x) wavelengths and organizes the images into folders with 1000 images per folder, in as many folders as needed. Image capture rate can be set as high as one image per second. A 25–30-minute flight that covers a 1.5-2 Ha site using the flight parameters outlined below will yield 5-6 folders per camera system producing 10-12 thousand images.
The MS sensors are particularly prone to difficulties writing to data cards and the data must be carefully checked and reflown if necessary. We keep a spare set of SD cards for each sensor and will not overwrite any cards until the data has been confirmed by loading into the processing software. For the MS sensors, ensure SD cards used are formatted FAT32, they will not work in EXFAT32 or other formats. Formatting cards should be done through the MicaSense wireless connection using the built in format card button.
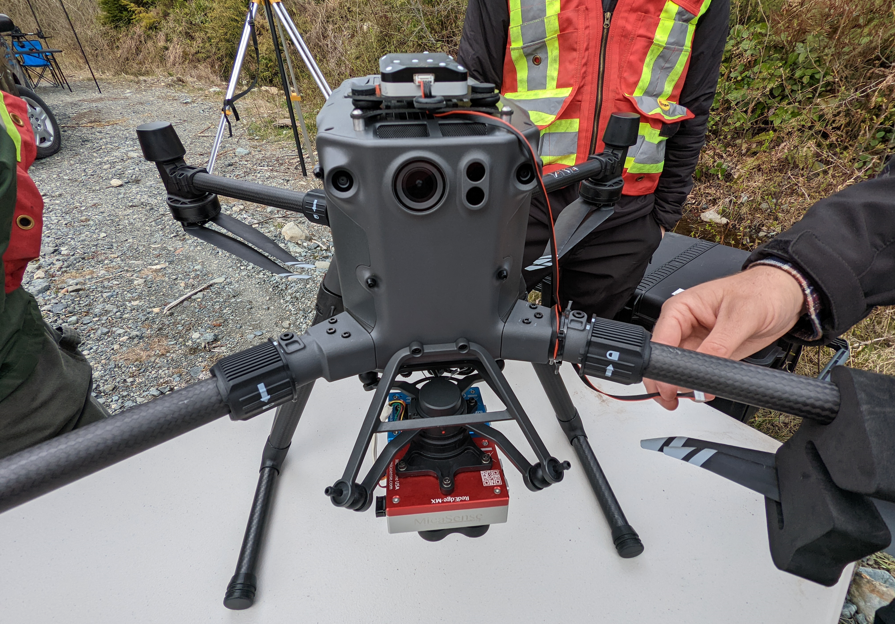
Figure 5.5: Micasense RedEdge-MX Dual and the DLS2 mounted on the M300. Here we are connecting the DLS2 to the Micasense camera.
Sensor Specifications:
Camera Type: MicaSense Dual cameras
Image Format: .tif with a suffix indicating the band (e.g., _1, _2)
Bands/Wavelengths:
| Band Name | Center Wavelength (nm) | Bandwidth (nm) | Camera |
|---|---|---|---|
| Blue | 475 | 32 | Red |
| Green | 560 | 27 | Red |
| Red | 668 | 14 | Red |
| Red Edge | 717 | 12 | Red |
| NIR | 842 | 57 | Red |
| Panchromatic | 634 | 463 | Red |
| Coastal Blue | 444 | 28 | Blue |
| Green | 531 | 14 | Blue |
| Red | 650 | 16 | Blue |
| Red Edge | 705 | 10 | Blue |
| Red Edge | 740 | 18 | Blue |
Image Capture Rate:
The default setting for timed intervals is one image capture every two seconds, with simultaneous capture for all bands.
The capture rate can be adjusted to a maximum of one image per second
Output: 5-6 folders per camera (10-12 thousand images) for a 25–30-minute flight covering a 1.5-2 Ha site
GSD: 2.5-4cm at 40m above canopy. 1.5-2cm when processed pansharpened with the panchromatic band.
Flight Parameters:
Flight Elevation:
- 40 m above canopy
Flight Speed: ~2 m/s (slower speeds reduce motion blur, especially in windy conditions)
Image Overlap: Extra high to ensure sufficient coverage and allow for exclusion of poor-quality images during processing.
Front: ~86% (speed and timed interval is the limiting factor)
Side: ~86%
Margins: 10 m around the site perimeter is sufficient for flight planning due to the wide-angle shot of the MS camera
Flight Time: Approximately 30 minutes for a 1.5-2 Ha area site. This allows for a single battery flight, which helps to maintain even light conditions.
Best Practices:
Weather Conditions: Avoid flying in any precipitation as MicaSense cameras are unprotected from moisture, with exposed data and power connections.
Lighting: Conduct flights within two hours of solar noon to minimize shadowing in the imagery.
- The DLS calibration helps to reduce the effect changing light conditions, but extreme changes in light conditions will leave residual effects that are difficult to process out. Figure 5.6 below shows a flight in variable conditions (left) in which the calibration has failed to correct the changing light conditions. The flight on the right was flown on an ideal day with even diffuse light.
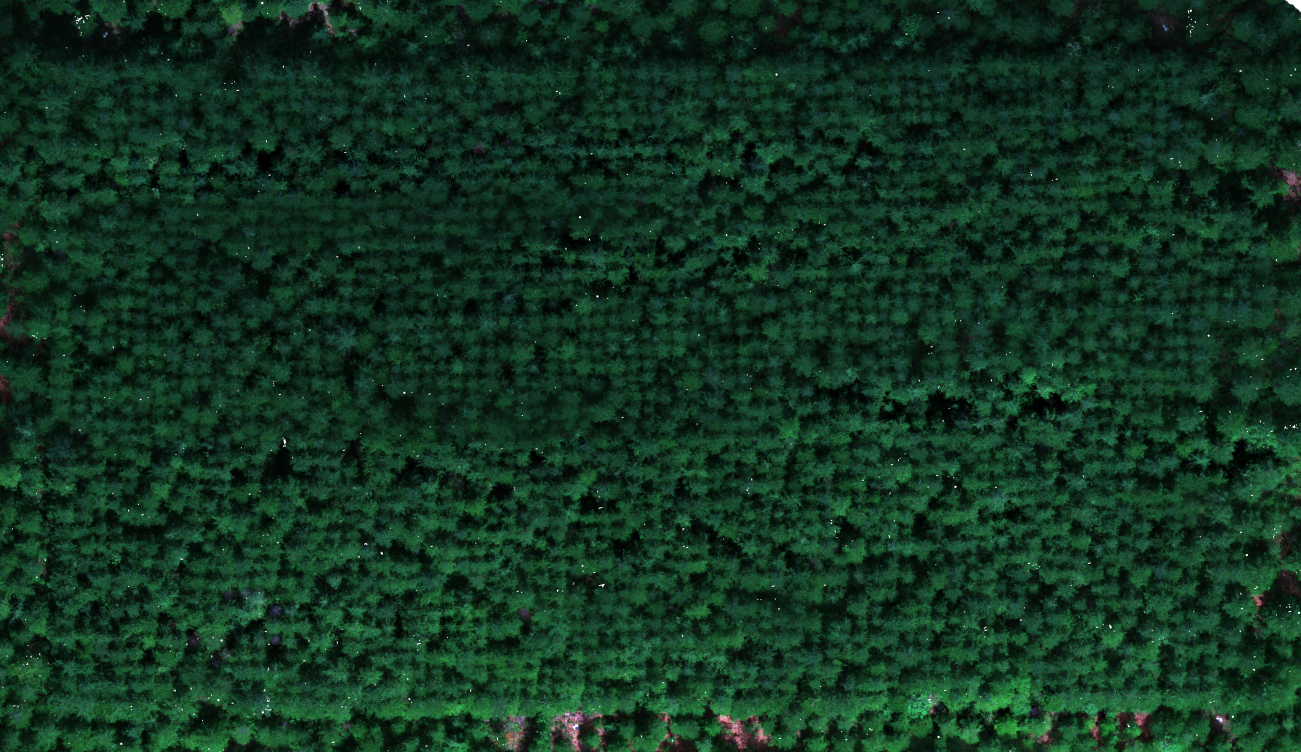
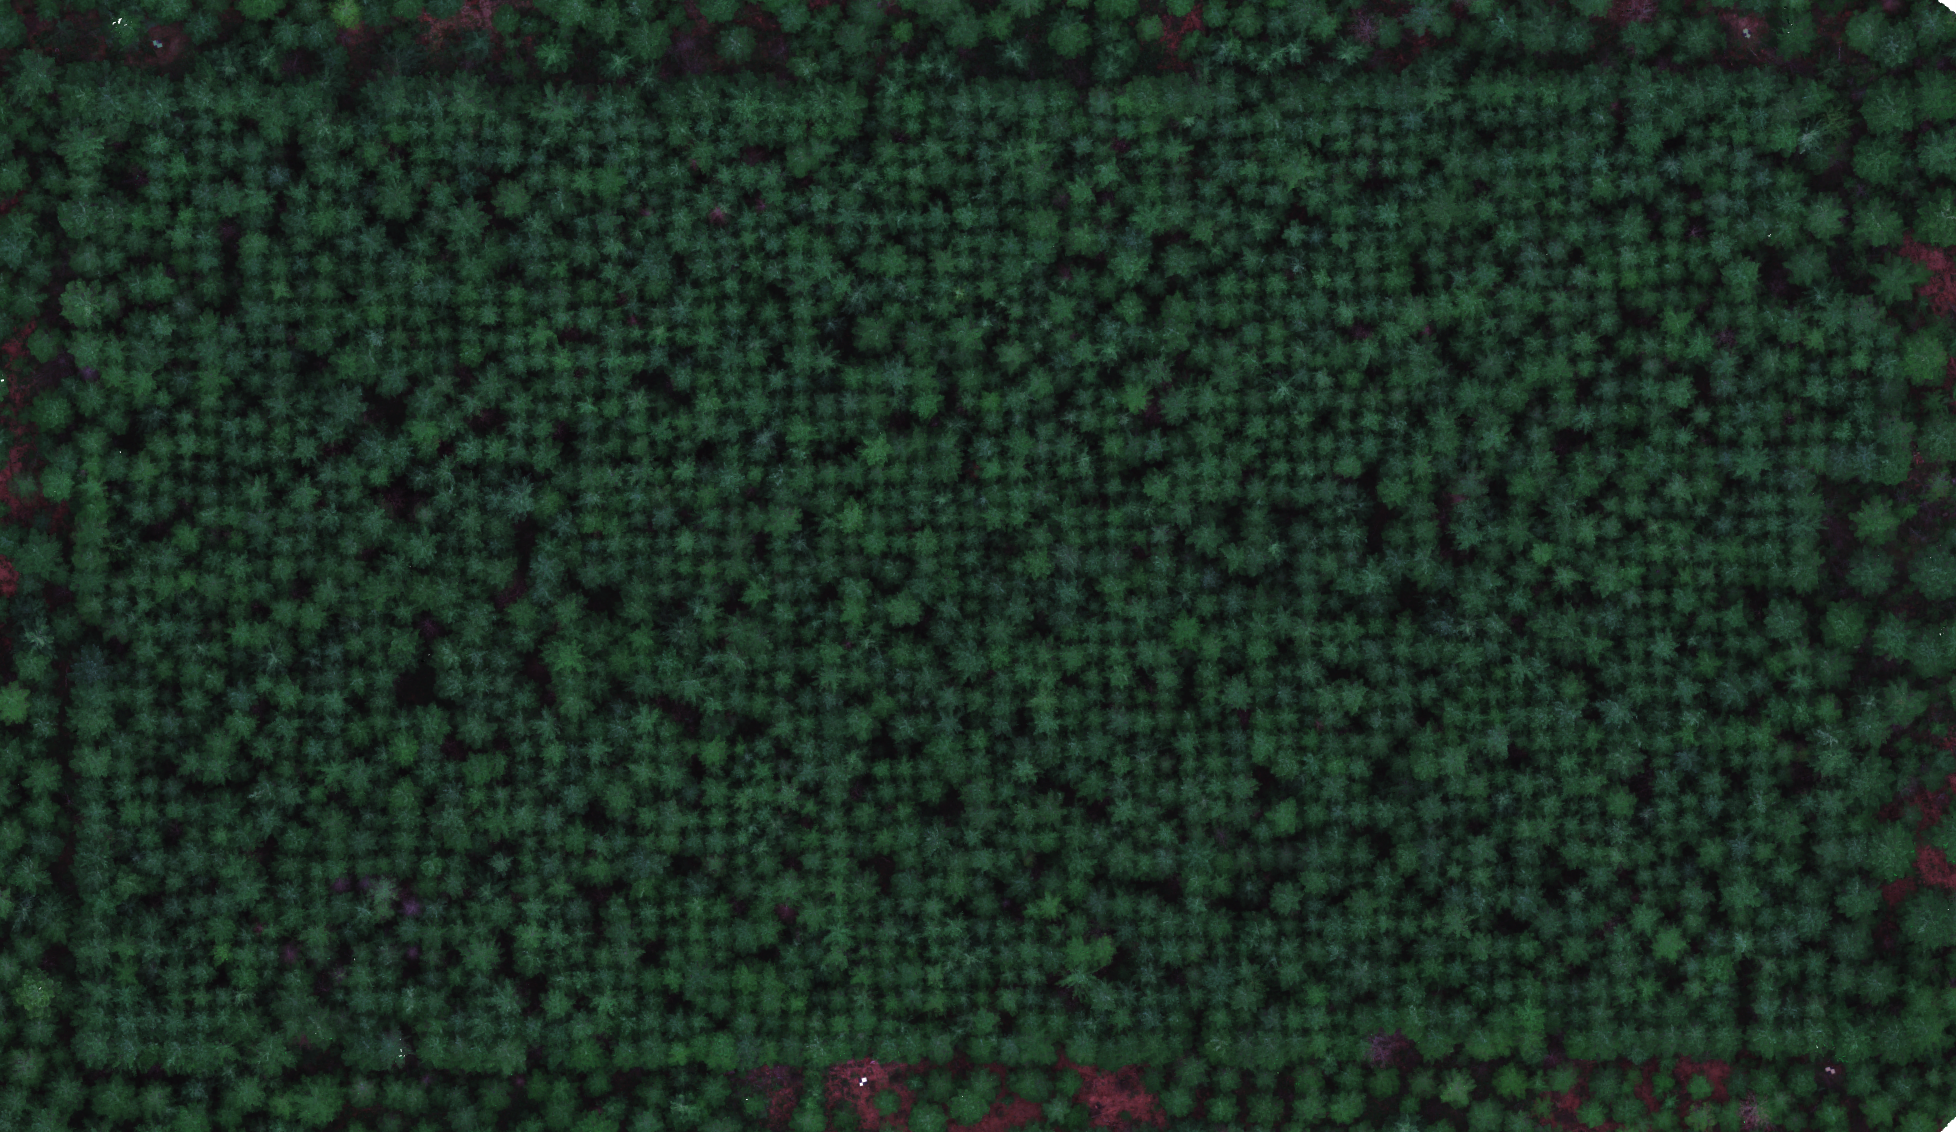
Figure 5.6: Left: MS orthomosaic in variable light. Right: MS orthomosaic in even diffuse light.
Wind Conditions: Lower wind speeds yield better results; however, the impact of wind will vary depending on species and site-specific factors. Consider flying at a higher altitude and overlap in windier conditions.
Flight Elevation Considerations: While lower flight elevations produce higher resolution images, they increase flight time, making calibration more challenging.
Click here to access our Micasense field SOP housed on GitHub.
Best practices: Collecting Data with MicaSense Sensors – MicaSense Knowledge Base is an important resource.
5.5.2 Zenmuse P1: High-Quality Natural-Colour (RGB) Imagery
The P1 is RTK/PPK enabled and has the highest resolution and positional accuracy of the sensors available. It is used for georeferencing, crown delineation, and to aid in the registration of data from sensors with less spatial accuracy.
Sensor Specifications:
Sensor Type: Natural-colour (RGB)
Resolution: 45MP
Pixel Size: 1cm per 80m altitude, 7-9 mm at the paramaters detailed below.
Positional Accuracy: 3-5cm without GCPs when using RTK/PPK.
Waterproof: No
Flight Parameters:
Flight Elevation: 65m above ground or canopy.
Flight Speed: ~4m/s.
Overlap: 85% front and side.
Margin: 20 m to reduce edge error and ensure higher image quality.
Flight Time: Approximately 15 minutes for a 2-Hectare site.
Best Practices:
Timing: Conduct template flights before spring flush or “greenup” in order to easily detect experimental trees from ingress and brush.
Wind Conditions: Ideal on days with little or no wind; <10 km/h for coastal species (e.g., western redcedar, Douglas-fir); up to 20 km/h may be suitable for other species (e.g., juvenile interior spruce).
Lighting: Best results are achieved on overcast days due to diffuse lighting conditions which reduces shadows and enhances detail. We have found that of full sun days using the “Auto” settings will produce oversaturated imagery. The sunny 16 rule of photography does help with the P1 on full sun days.
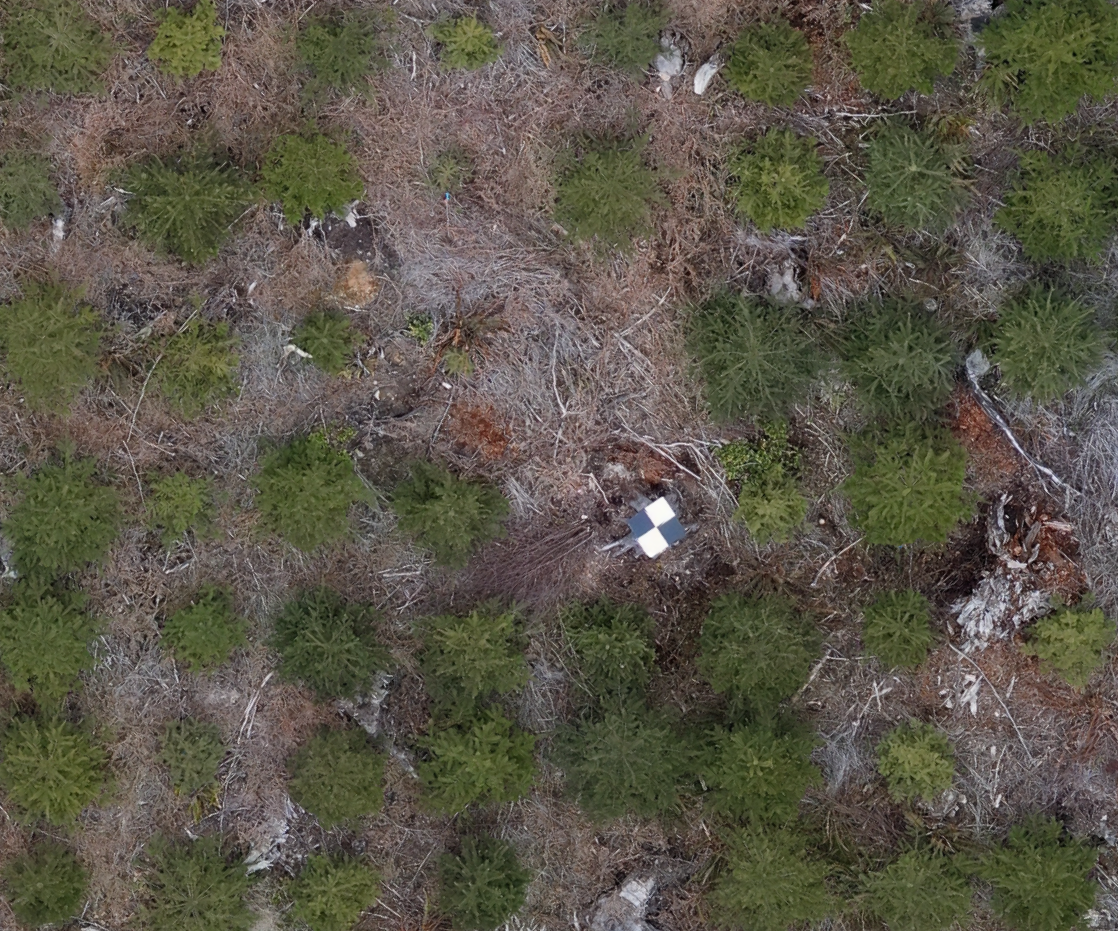
Figure 5.7: These images are the same area, the left was taken with the above parameters with the P1 before greenup. The right was taken with the wide angle RGB on the Zenmuse H20T, a lower resolution camera, mid-August.
5.5.3 Zenmuse L1: LiDAR and RGB
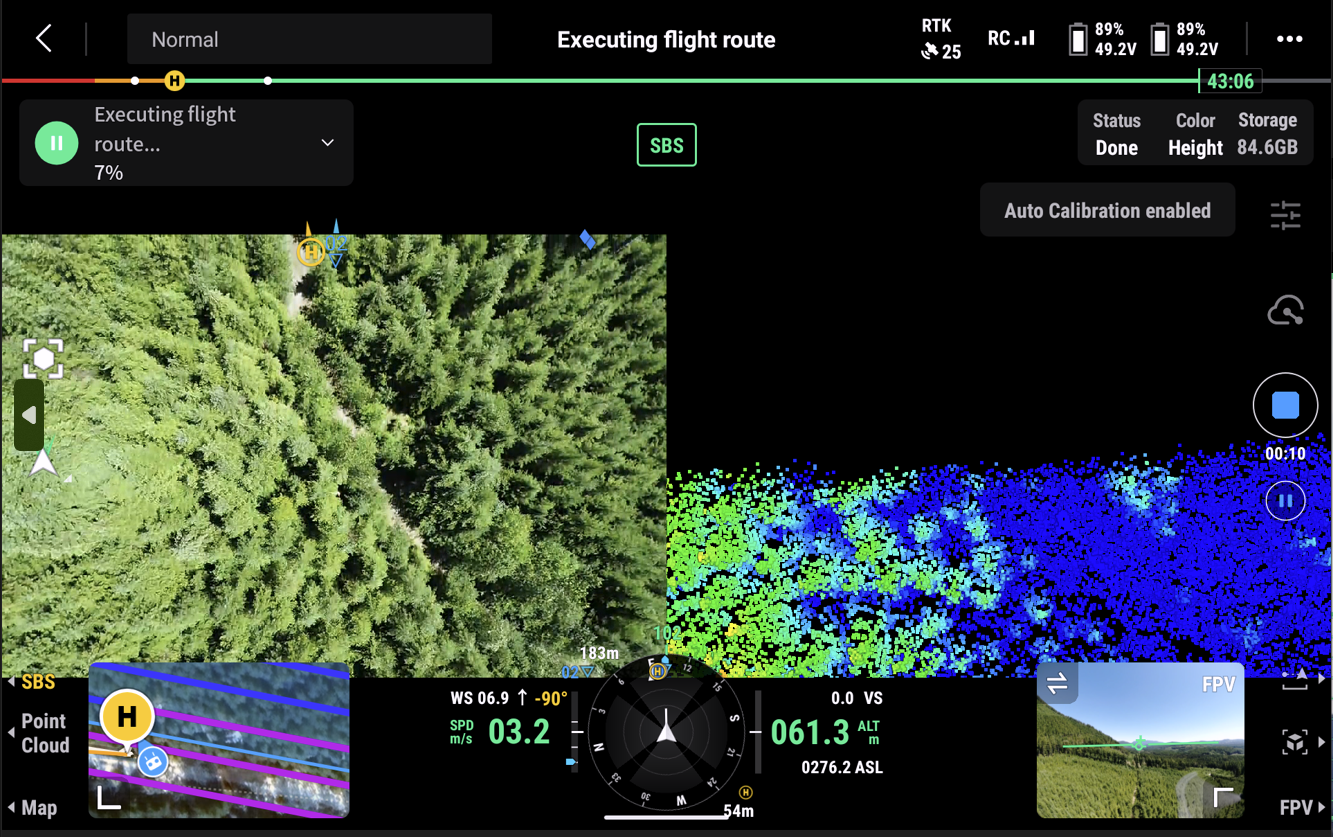
Figure 5.8: L1 LiDAR screenshot from the remote controller during a flight at Big Tree Creek site on July 7, 2024. On the left is the RGB image instantaneously acquired for the frame and the right shows the LIDAR data acquisition from the scanner as it acquired the data up the frame.
LiDAR (Light Detection and Ranging): LiDAR is an active sensor that emits laser pulses at specific wavelengths and measures the time and intensity of the returns to calculate distances. This allows it to create precise 3D models of the terrain or objects. LiDAR relies on a highly accurate Inertial Measurement Unit (IMU) and GNSS to calculate positional data, including roll, pitch, yaw (orientation), and X, Y, Z coordinates (spatial position), enabling accurate georeferencing of the collected data.
The L1 LiDAR is used to build DTMs for terrain following when one is not available and is flown again with terrain following to calculate tree metrics.
Sensor Specifications:
Echo Mode: Triple returns for penetrating vegetation and tree canopies. Ideally this will record three distinct returns per pulse: First Return- Typically represents the top of the canopy. Second Return- Represents mid-canopy layers or understory vegetation. Third Return- Represents the ground
RGB Imagery: The L1 also includes a 20 MP RGB camera, which can be used as a lower resolution substitute for a P1 camera.
System Accuracy: 10cm Horizontal, 5cm Vertical (50m AGL)
Moisture Resistance: Rated for rainy or foggy conditions, but moisture in the air can result in noise and overall degrade point cloud quality; not recommended to fly in such conditions.
Flight Parameters: These settings have been effective for coastal open and closed canopy sites.
Repetitive Scan Mode: Recommended for detailed terrain and vegetation profiling. This is being further tested.
Inflight Automatic Calibration: Highly recommended for accuracy; the IMU recalibrates every 100 seconds during the flight.
Overlap: 85% front and side (85x85) for RGB imagery.
Flight Elevation: 60-85 m, depending on site conditions.
Flight Speed: Approximately 4 m/s.
Point Density: Greater than 1500 points per square meter.
Elevation Optimization: Should be turned OFF to avoid inconsistencies in the point cloud dataset.
Timing of Flight: When possible, it is best to collect LiDAR before greenup in the spring. LiDAR is typically taken before or after multispectral flights as it is not constricted to the -/+ 2 hours of solar noon window.
Zenmuse L2 LiDAR: The recently released L2 LiDAR sensor offers improved positional accuracy due to a smaller beam footprint and more precise IMU. It also supports up to five returns per pulse, enhancing the within canopy detail of the point cloud and potentially defining a more accurate DTM for areas with understory.
5.5.4 Zenmuse H20T: Thermal and RGB
Thermal Imaging (H20T DJI Thermal Camera): The H20T is a multi-sensor camera with thermal imaging, zoom, and wide-angle RGB (visible light) cameras in one sensor, allowing it to capture detailed visual and thermal data. The thermal sensor detects infrared radiation and converts it into temperature data, which can then be used to analyze heat signatures of objects, terrain, or structures. The H20T also integrates a laser rangefinder for accurate distance measurements, which can be useful for checking and confirming terrain following flight mission altitudes.
Note: The H20T was not designed for thermal mapping and the raw thermal imagery needs to be converted to single band temperature tiffs. Our conversion method is detailed in the Thermal Conversion chapter.
GCP’s are very helpful with thermal imagery. It is dificult to confirm that the crown polygons are positionally accurate without them, especially in closed canopy sites.
Sensor Specifications:
GSD: Thermal ~6cm at 70m, RGB wide ~2cm at 70m.
Zoom: The H20T has a 23x hybrid optical zoom with digital zoom capabilities for a combined zoom of up to 200x in RGB mode.
Thermal Sensitivity: <50 mK at f/1.0, providing high sensitivity for detecting slight differences in temperature.
Spectral Band: The thermal sensor operates in the 7.5 - 13.5 µm range, which is ideal for detecting heat sources in various environmental conditions.
Thermal Accuracy: The temperature measurement accuracy is ±2°C or ±2%, whichever is greater.
Gain Mode: The High Gain mode measures temperatures from -40°C to 150°C at a finer scale than the regular gain mode. It is highly recommended to ensure the high gain mode is set for this application.
Flight Parameters:
Optimal Flight Altitude: The size of our sites required ~70 m altitude. Flying as low as possible based on system and terrain restrictions yields more detailed thermal data.
Flight Speed: Recommended at 1.5-4m/s depending on site size, aim for slower speeds if possible to maximize thermal data quality.
Overlap: Thermal: >85% front and side overlap (85x85) to ensure comprehensive coverage
Environmental Conditions: Best in low wind clear conditions.
Timing of Flight: Best results from early afternoon. We found that imagery taken later in the day can be overwhelmed by radiant heat and ealier has heavy “shadows” from overnight temperatures.